
Sensex Technical View :
As before the important levels remain 9300 and 10500 odd on the range in near term. So in this tight range it could be a wait , watch and then react scenario. On a sustained closing above 10500-10700 there could be a shot to 50 % level of 11650. Sustaining above the 38 % level of 9600 odd for some sessions would signify more strength, but a test of 9300/8900 cannot be ruled out.
Technically its a situation where one needs to look at market movements closer to the lower and upper range. If we see a sustained move above 10500 -10700 we can expect 11650 and to an outer extent. On the other side Sensex has seen 2 sessions with a low of around 9630 which is around 38 % retracement sustaining below that could test the 9300/8900 zone .
So next 3-4 sessions would give a better indication of what Sensex has in store for traders.
Possible Head and Shoulders :
There could be numerous possibilities with this pattern but till we dont see a breakout/confirmation its better to wait then take conclusions. Have got some queries on a possible inverted head n shoulders so a quick chart posted.
In the chart above have put up a few HNS patterns -not all are exact. In some cases we saw a good breakout on either side which gave a clear direction to markets. The chart is self-explanatory and made quickly so have not included tgts , levels etc just a graphical /text presentation.
Stocks to watchout for :
Some stocks which have seen good volumes at lower levels and can give a possible bounce back . Traders need to be quick with stops as some can give false moves also.
Deccan Chronicle.... needs to sustain above 48 for tgt 55-67.
Century Textiles .... above 215 can tgt 265.
NALCO .... above 173 can tgt 185-205.
A very good indication for a sharp short term stock trader would be the top levels made on 5 November or the day we hit 10945. In case markets do give a move above 10500-10700 , stocks which cross and sustain above recent tops can give a decent 5-15 % trading opportunity on upside with a small stop .
For example :
BHEL above 1470 , ONGC 810 etc etc ... So put a rough calculation and make your trading list as this could be intra-day triggered trades.
It is time for Government and SEBI to make stock exchange functioning a more transparent one. It is time to remove broker’s stronghold over BSE. SEBI should reveal all the major transactions and suspicious activities on daily basis. It is time for reforms to gradually replace hot money from stock markets and make them less volatile and more investor friendly.

Former Federal Reserve Chairman Alan Greenspan on US economy: He was frank in his assessment and admitted his mistakes.
"We are in a recession, very severe, there's no question and Gross domestic product in the United States in the fourth quarter is going to be down significantly. We know we are going down and there's very little we can do about that. It's important to recognize we are not in quite a free fall but something close to it. Economy, and indeed the world economy, has tilted over and is moving down fairly aggressively, pretty much across the board. There's no way of preventing what's going on now. That was caused by the shock of the financial system a couple of months ago. All bottoms look like what we're looking at now, but it doesn't follow that this bottom always leads to a recovery. It may just be another stage before you go down again, and I'm not going to forecast where we are going because I frankly don't have a clue. "
China stimulus package: China announced $570 billion stimulus package to spend over next 2 years. China Government will spend this money to finance projects in low-income housing, rural infrastructure, water, electricity, transportation, the environment, technological innovation and disaster relief programmes
Economic statements:
1. India’s GDP growth will be around 7-7.5% - PM Manmohan Singh. Is he sleeping till now?
2. Kamal Nath: We need to pump Rs 25,000 crore in the next 6 months into infrastructure without worsening fiscal deficit.
3. Real Estate prices in India will further correct by 50% - SBI Chairman O.P. Bhatt.
4. Only 0.25-0.50% of the country’s population lost money in stock markets and real estate and that should not be the reason to panic- SBI Chairman. How ignorant he is. Does he know about 80:20 rule? How only few people always influence consumption and economy. It’s not about number of people but amount of money.
5. Indian financial crisis may end in 2 years – Bakul Dholakia, former director, IIM-A.
6. Inflation will come down to near zero by March, 2009 - Edelweiss CEO Rashesh Shah.
7. “Global trade will decline for the first time in 27 years” - World Bank President Robert Zoellick.
8. “We will become bankrupt without a bailout package or merger” – General Motors.
Financial statistics:
1. CII: Indian GDP growth rate will be around 7.4-7.8%. CII’s earlier estimate was 8.3-8.6%. We will see further reduction in estimates by January. My estimate for current ear is around 7%. India’s GDP growth in the next year would be around 6%.
2. Estimates: US retail sales probably fell in October by the most since the 2001 recession, Bloomberg Survey. Actual report will come out on November 14.
3. 19 US banks failed in 2008 and more will fail in the coming months.
4. Indian exports will by 20% in FY2008-09 and fail to achieve $200 billion target. Sectors that will be affected are Textiles, apparel, gems and jewellery, diamonds, brassware, handicraft and leather.
5. The number of employed Asians in America fell to 68,70,000 in October from 69,04,000 in September.
Positive Stock market news:
1. Lupin will launch new cardiac drug in India. Cardiac drug market in India is around Rs 3,600 crore.
Negative stock market news:
1. OPEC nations are planning for cuts in output to stabilise crude oil prices.
2. HDFC Bank lodged a FIR against PNB for bungling Rs 7.9 crore.
3. Reliance Retail will shut down some stores and will restructure its business. Big TV DTH CEO quitted. Retail sector will face hard time in the coming months due to fall in domestic consumption.
4. Bajaj Auto slowed production due to fall in demand and piling up of inventories.
Global recession news:
1. Britain: 8.8% individuals and 10.5% corporations declared insolvent in the third quarter in England. This is 26% high over previous year and is expected to reach 50% high by the end of fourth quarter.
2. USA: German logistics giant Deutsche Post will announce around 20,000 layoffs in America. Another 20,000 jobs will be lost in partners. Shocking news!
My views on OM stock picks: Outlook Money magazine in the latest issue picked 8 stocks for accumulation which will give good returns for long term investors.

1. Bank of India: Best PSU Bank for investment. SBI is the next best stock.
2. Titan Industries: Wonderful performance in the last quarter.
3. HDFC Bank: One of the “best 7 banks in the world”. Axis bank is another option.
4. KS Oils: Fastest growing company in the safe business.
5. Mphasis: Best stock in the IT sector. Wonderful performance in the last quarter.
6. Bharti Airtel: Good stock but large FII holding is a concern. They may exit if things deteriorate for Telecom sector.
7. Indraprastha Gas: Conservative stock.
8. Emami: I am not tracking it.
Click here to read more about Outlook Money stock picks.
Good article:
1. Why one should bet on China?
Financial jargon: LIBOR.
LIBOR is the London Interbank Offered Rate, a measure of the rate that banks assess other banks for loans. LIBOR rises mean things are bad. ICICI Bank recently faced problems in this aspect. Confidence is crucial in financial system.
Obama and Outsourcing: I failed to understand the logic behind the positive statements on “outsourcing” and why they are underestimating a tough leader like Barack Obama. He will act in a ruthless manner in creating jobs for Americans. If imposition of taxes on outsourcing companies will create jobs for Americans, he will just do that.
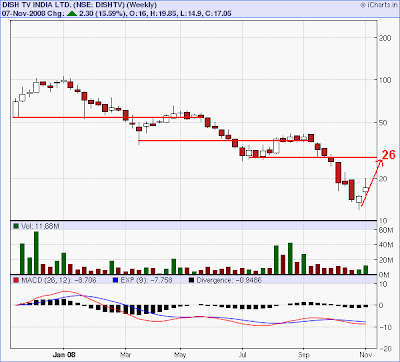
CMP : Rs 17.05
Target: Rs 26
Returns : More than 50%
Time Frame : 2-3 months
Stop Loss : Rs 16 on closing basis
Charts Shown : Dish TV 1-Year Weekly Charts
This type of trader is looking to hold stocks for long periods of time. They buy stocks that are first breaking out of basing patterns into a stage two uptrend. This is likely where you will see institutions buying stocks. This buying pressure is what starts the uptrend. They are hoping that the next two groups of buyers will push the stock higher.
Momentum Trader
This type of trader buys stocks that are, well, showing momentum! They buy stocks right after a major move in a stock and hold for a short period of time. They are hopping on a board a fast moving stock looking to capture short term gains quickly.
Swing Trader
This is where you come in! You are trading the swings within the trend. Here is a chart that may help you to better see how everything unfolds…

On the chart above you can also see the traders action zone which is the area in between the 10 sma and 30 ema. This is where you, as a swing trader look for reversals back to the upside when going long and reversals to the downside when shorting stocks. I've drawn arrows on the chart to show where you get buy (green) signals and short (red) signals to enter a stock. Pretty cool, huh?
It doesn't matter whether you use sma's or ema's. There is little difference between the two so don't get caught up in the variations. We are just using these moving averages to create a zone that we will find our entries for long and short positions. We'll cover the entries (and exits) on a separate section of this site.
What is so special about this zone?
In case of Swing Trading a lot of reversals happen in this area. So in order to create a focus in your trading strategy, it is helpful to narrow down your potential stock setups to one area on a chart. This zone provides a plethora of setups on a daily basis.
We are not really concerned with the moving averages themselves. When a stock pulls back into this zone, look to the left to identify support and resistance, trend lines, candlestick patterns, etc. You are looking for multiple signals all pointing in the same direction.
Swing Points
For a swing point low, the first candle makes a low, the second candle makes a lower low, and the third candle makes a higher low. This third candle tells us that the sellers have gotten weak and the stock will likely reverse.
For a swing point high, the first candle makes a high, the second candle makes a higher high, and the third candle makes a lower high. This third candle tells us that the buyers have gotten weak and the stock will likely reverse.
Here are pictures of the candles to help you better understand swing points:

For our long entry strategy, we are trying to find stocks that have pulled back into the Traders Action Zone that have made a swing point low.
You can see on the Nifty chart above that .. yes Nifty is in a nice uptrend with the 10ma above the 30ema. The stock has pulled back into the Trading Zone and made a nice swing point low (highlighted in red Circle).
See how the pattern consists of a low, lower low, then a higher low? Great! Our entry strategy would be to enter this stock on the day of the third candle.

GOLD Weekly:: An Bullish Bat Pattern formed .. Maximum downside for valid pattern at last low $680 to $650.. (If break $650 then pattern not valid) As far as stay above $650 we see strong up move form decline.. This pattern in weekly chart and that’s why wait for some more week for decline or consolidate at current level then buy..
(All you know we predict top in Gold chart above $1000 and may be this time we predict bottom ..!!)

Sensex Elliott Wave Count :: Here we plot three alternate wave count of BSE 30 Index.. 1st one is Cycle Impulse wave 1-2-3-4-5 of 3 still running or may be finish with last bottom.. 2nd count with red circle Cycle Double Zigzag W-X-Y of last leg Y still running or may be finish. And last as green circle Cycle Double Zigzag A-B-C-X-A-B-C of last leg C may be finish or may be some down side left ..All three wave count match target of Sensex in between 8500 to 6000.. Last count as blue color Intermediate Flat A-B-C of B may be finish as far as stay above 9630. And start C leg for Target of 11,375/11,640/12,240/ 12,880..
(Very difficult to plot such kind of unfold complex wave count but we try to predict each and every thing, lets see what’s happen in coming day’s..)
 Nowhere to run.
 BUY RELINFR ABOVE 573 TGT 611>630 STOPLOSS 553
 NIFTY WEEKLY strong resistances zone 3254-3463
 The Indian market opened on weak note and saw choppy start but nifty recover in afternoon session and close in green zone. For coming session if nifty cross 3010 it can test 3125-3156 zone on the lower side 2850 will act strong support zone
 BUY IOC ABOVE 370 TGT 381>393 STOPLOSS 363
Last week nifty gains 3,30% and continuing the momentum for upside .For the coming week nifty is forming invert Head Shoulder pattern on daily chart it need to break neckline with volume for valid pattern. For coming session if nifty close above 3024 it can test 3125- 3189 on the upside 3254 will act strong resistances zone, if nifty able to cross3254 zone it will test 3439-3569 zone on the lower side 2850 will act support breaking below 2850 it can test 2750 -2729 zone .On weekly nifty had made inverted hammer pattern it showing on the upper side nifty will face strong resistance near 3250 zone .


The tally of failed banks in 2008 rose to 19 as the government announced that a Texas and a California bank had been shuttered Friday night.
Franklin Bank, a Houston, Texas-based bank and Security Pacific Bank, a Los Angeles, Calif.-based bank were shut down by state regulators Friday, marking the 18th and 19th bank failures this year.
Franklin Bank (FBTX) had total assets of $5.1 billion and total deposits of $3.7 billion as of Sept. 30, 2008, according to a statement on the Federal Deposit Insurance Corp.'s Web site.
Sell Nifty futures below 3085, Target: 3060, 3035, SL: 3110
Buy Nifty futures above 3030, Target: 3050, 3075, SL: 3010
Sell Reliance futures below 1280, Target: 1260, 1240, SL: 1285
Buy Reliance futures above 1240, Target: 1260, 1272, SL: 1236
Buy Suzlon above 72, Target: 75, 78, SL: 70
Buy Relinfra above 570, Target: 584,600 SL: 565
Sell Tatamotors below 159, Target: 156,153, SL: 161
Buy Icicibank above 440, Target: 448,460 SL: 436
Sell M&M below 362, Target: 355,350 SL: 367
On a break out on either side, the likely resistances & supports are 3050-3070 & 2780 - 2750.
1) 5 DSMA is at 3000, 5 DEMA at 2955. So for long trades, these levels should hold.
2) If market weakens or reaches overbought while trading near 3050-3070, book longs.
3) And create shorts on the first sell signal (or likely to emerge).
4) If breaks 2860, hold shorts & book out near 2750-2780 area.
5) These are model guidelines & to be traded as per our first "15 minute ORB(Opening Range Breakout)" and SAR in intracharts.


Nifty took support around 2850 levels and moved up once again. Global cues remaining positive next week , NS can retest 3085-3120-3200 zone once again..cross of 3240 can zip the markets to 3650 zone..Time to be cautiuos at highs again ,as the markets can go lower(Break of 2860 will zip us to lower levels of 2631-2525 quickly) to either test old lows or make higher lows . If the lows hold ,then it is time maybe to buy for medium term, the better performing stocks.. hold them for 2-3 months for a ride up.Remember monthly S/R is 3050 for NF..Happy Trading....cheers

No comments:
Post a Comment