Sensex takes a quick dip after hitting 10900 and is quickly down to 9700 losing more then 1000 points . The nearest support zone remains around the 9300-9350 zone . Also 61 % of the current bounce comes to 8900.
At the same time the lowest gap is placed at 8740 -8900. This should be a major support which needs to be watched for a trend change.
On the upside 10200-10500 should be a stiff resistance. Sensex is currently in between the range and that is precisely the reason why it was mentioned yesterday to just wait and watch only.
In the day high volatility was seen with traders getting many opportunities whereas it may also be termed that traders were hit on either side. Such kind of volatility will remain in days to come as indices are in an indecisive mode.
DOW Jones Technical View :
Dow Jones has also corrected from the resistance zone of 9600-9800 and should now test the retracements around 50/61.8% around 8550 /8750 levels. So Technically one needs to observe that zone in coming days for any signs of base formation again.
Stocks to watchout for :
Reliance tried to give a bounce from 1170 zone and will continue to see some support around the 1150 zone. Kotak took a u -turn from 445 and might have given a small trading chance.
Will wait for further stock picks as for the index we are in a no-trade or watch zone. Fresh trades any may be generated in the day only.
Market Observations and Thoughts :
Few months back there was whole lot of discussion going around CRUDE , inflation , forex derivatives, money market liquidity in india and subprime , housing bubble , inflation , CDOs, bank failures etc around the world .
Suddenly many of the above things have been accepted in cases whereas others have ceased to exist. The consensus is many economies around the world may get into a recession or slowdown.
I am bad at economics so just read what receession means as per wikipedia.
a significant decline in economic activity spread across the economy, lasting more than a few months, normally visible in real GDP growth, real personal income, employment (non-farm payrolls), industrial production, and wholesale-retail sales."A sustained recession may become a depression .
a rule of thumb that recessions are often indicated by two consecutive quarters of negative growth (or contraction) of gross domestic product (GDP).
A pure read of that tells me for India with a GDP of worst case 6.5-7.5 % it would still be faraway from a technical recession.
There are many things which can be discussed on this topic but will start of with inflation nos which i do have a brief statistical logic on. Although the nos may not be a direct reflection of the actual inflation but continues to be a decider for economic policies.
Some points which may turn it around
1) The major rise in inflation to double digits came in after crude price rise. Indian fuel pricing is around 67 $ and a rate hike may come only again if it comes to above 100 or rate cut if it goes to 50 maybe a rough estimate. My rough guess is crude may not touch 100 + so no cut.
Now what could happen as inflation is rate of change by next year around the price hike dates the impact of rise in inflation may come down or say base effect reduction.
BASE effect first disucussed some time back read it --- http://nooreshtech.blogspot.com/2008/09/inflation-base-effect-may.html
2) There was an acute price rise in commodity and food prices which led to a quick rise in inflation . Such a steep rate of rise may not be emulated next year in current scenario so there could be another impact of stability from this side.
3) There is a belief that the liquidity is not a major concern in Indian banking system but its the confidence and sentiments which is not allowing a flow in the system even after adequate measures. Its a difficult thing to judge but when things become clear in the next 6 months it can lead to a possible surge in corporate lending in a low interest regime also. At the same time it could give strength to inflation as there could be lot of liquidity chasing things but can it be so quick again to bring up a rise in inflation seems difficult.
Al in all as from my previous projections which went right on the economic timing of Sept/Oct to see the peak of weak economic data but was not able to gauge the nos on the index front correctly. So the next 3-4 months around Nov- Jan would see some weakness in data every now and then but may not be major as Oct ideally. As before the view remains of economic though process may change around Jan-Mar and start looking up around March- May 09. Lets c how it pans out this is just a projection personally which may not be adequately researched or accurate.

In case 2763 breaks, nifty will be sold into in any upmove and will be in a position to retest new lows again ( this is an overall positional view)
Now for Intraday, after the gap down, we will still watch 2763 , if breaks may see 2721 for intraday.
if 2763 holds, may pull back to 2794-2833
Here is a simple price action Vs EMA strategy to predict the next day's trend of the Index or Stock. Though it is an easy strategy it will provide you absolutely amazing profits.
I like to call it a Sure Shot Strategy
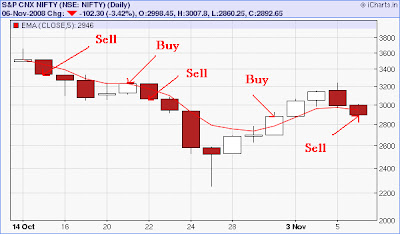
Above Nifty Chart Shows Buy/Sell Signals Buy means Buy or Exit Shorts .
Sell Means Short or Exit Longs
Enter Long - Exit Short Strategy
If Price Closes above 5 EMA then Enter long or Exit Short
Enter Short - Exit Short Strategy
If price Closes below 5 EMA then Enter Short or Exit Longs
For Intraday :
Use 5 min-EMA or 15 Min Charts .... Use Above rules for
your entry and exit
Note : Buy/Sell Decision Should be taken only on closing of the candle
No Need of Listen to the so called Experts views to choose your short term stocks

Nifty :: We clearly indicate such kind of situation in our 5th post.. Yesterday Nifty exactly take our strong support and move up but unable to sustain at higher level and once again came near support level and hold above it.. Now for 7th Nov. 2860 works as important level below it momentum once again turn down sharply up to strong support 2775/2750..Below it next strong support at 2633.. Avoid selling at low or at support level. Still mid term bullish structure intact (up to 2450).. Sell only at high and buy on deep… resistance for up move at 2950/2971/3000/3120.. Supports 2860/2775/2750/2633/2450..
 The Indian market opened weak note and saw smart recovery in afternoon session . Market fell sharply after inflation number came higher from last week and market closed in deep red zone .For coming session 2832 will act support zone if we break 2825 we will test 2754 zone on the other side 3008 will act strong resistances zone. We can see some bounces from 2750 levels and 2.30 factor will important .
The global clues are poor to gain strength in our markets. At this juncture the Bulls are want of energy to take on the crippling indices to higher levels. As posted yester day the nifty took support at 2860 level but lost the momentum strength that built in the after noon to the inflation news that rose to 10.72% from 10.68% on weekly basis though is not a concern at this hour of credit crunch.
The statement from chairman of SBI that took a beating that the stressed assets may increase as NPAs in future is a clear sign of recession. The banking industry is the torchbearer of the bull move may now take sides for the Bears.
As per the reports, the bank of England has cut the rates by 150 bps to 3%, lowest in the last 50 years, shows the liquidity concern and the slowdown in growth. The markets shall take it as a positive step, in the long run will help the industry as the crude came to a very reasonable level where every body willing to pay for it.
The global markets are in deep red despite of many adequate measures announced by various governments to mitigate the financial crunch and mitigate the fears of slowdown. There was no solace to investors but the blue chips are at attractive valuations.


Welcome to the grind. We are now sure to test the bottom again. What else?
 Reliance was never able to cross the gap.
2946 - 3045 is now a critical resistance zone(5 Day ema & 5 wk ema).
The ferocity of yesterdays fall & todays intra fall from 3006 suggests of a 5th wave down. On the other hand, if it holds 2750 - 2780 and rally up , clearing daily ema with volume, then a possibility of a rally.
Let us remember, the fall is not like a correction & the daily trend has turned down by closing below 5 DEMA (2948) today.
Read this article on Bear Markets..Very interesting & educative.


We expect more fall in Indian market.
Global cues are extremely negative.
US economy showing more and more concern.
DOW lost historic 10 % in last two days. 4.85 % yesterday.
ECB, BOE trying to support their economy and cut rate by 50 BPS.
IMF cut Indian GDP forecast for 2008-2009 and 2009-2010.
IMF Cuts global Global growth forecast to 2.3 %
Most of world indices closed in red.
Aggressive unwinding seen in momentum stocks.While
metal stocks seen fresh short building. Asian market slips.
Some news stated above and much more news sugest
further fall in Indian and world market. Most of world market
were seen down after win of Obama. They corrected around 10 % in last two days
still are 10-15% away from recent lows.We expect sensex may test recent lows.
Stay away from any fresh investments..Market may open with weak note.
S Kotak
------------------------------
Nifty Close : 2892
Pivot point : 2921
Short till 2987 with stop loss 3017
lower target : 2801-2777
(Nifty Nov. Fut trading at 5 points discount).
------------------------------
Trading Zone : 07-11-2008
______________________________
Stock Close Call Stop Loss Target
______________________________
AKRUTI 652 Short 677 639-627
TATA COMM 509 Short 527 477-447
RPL 83 Short 85 78-74
RELIANCE 1170 Short 1187 1140-1109
INFOSYS 1245 Short 1264 1211-1176
Note :AKRUTI SPOT CLOSING IS 652 While Future closing is 557....14 % down!!!!!
Which SUGGEST Tremendus weakness
------------------------------
IVRCL : It seems that IVRCL may stop its up move around 142
Close : 131 Short rate around 142. Once it make initial top, short with sl- RS-5
with TARGET 116-101 in a day or two...

No comments:
Post a Comment